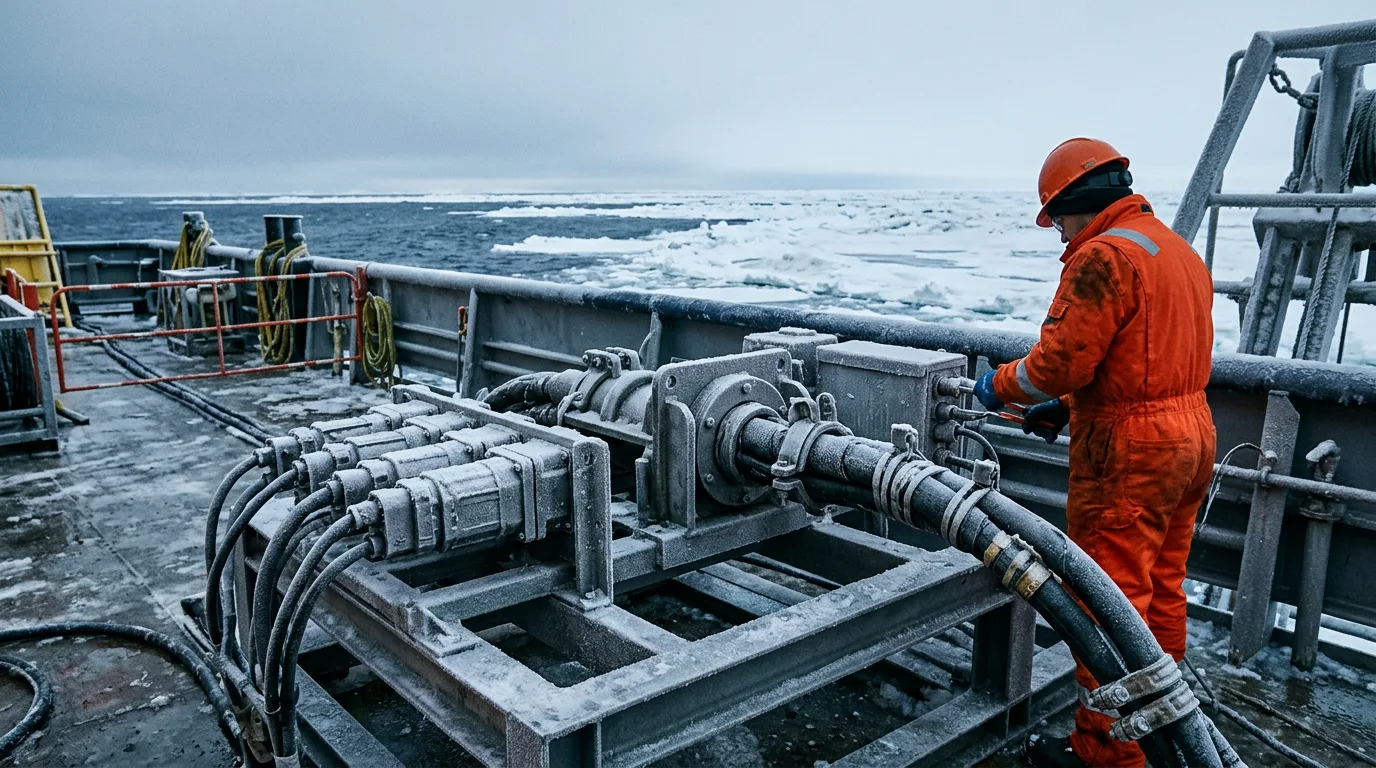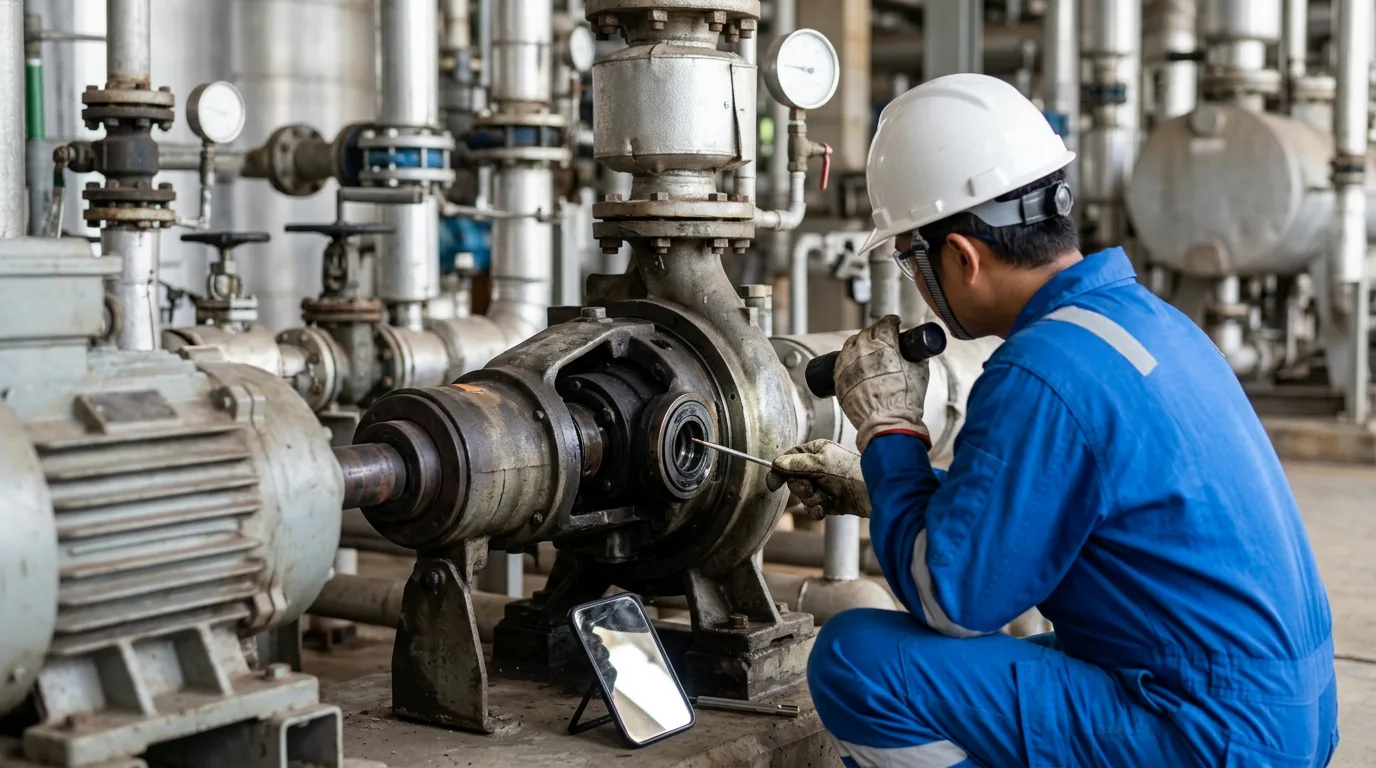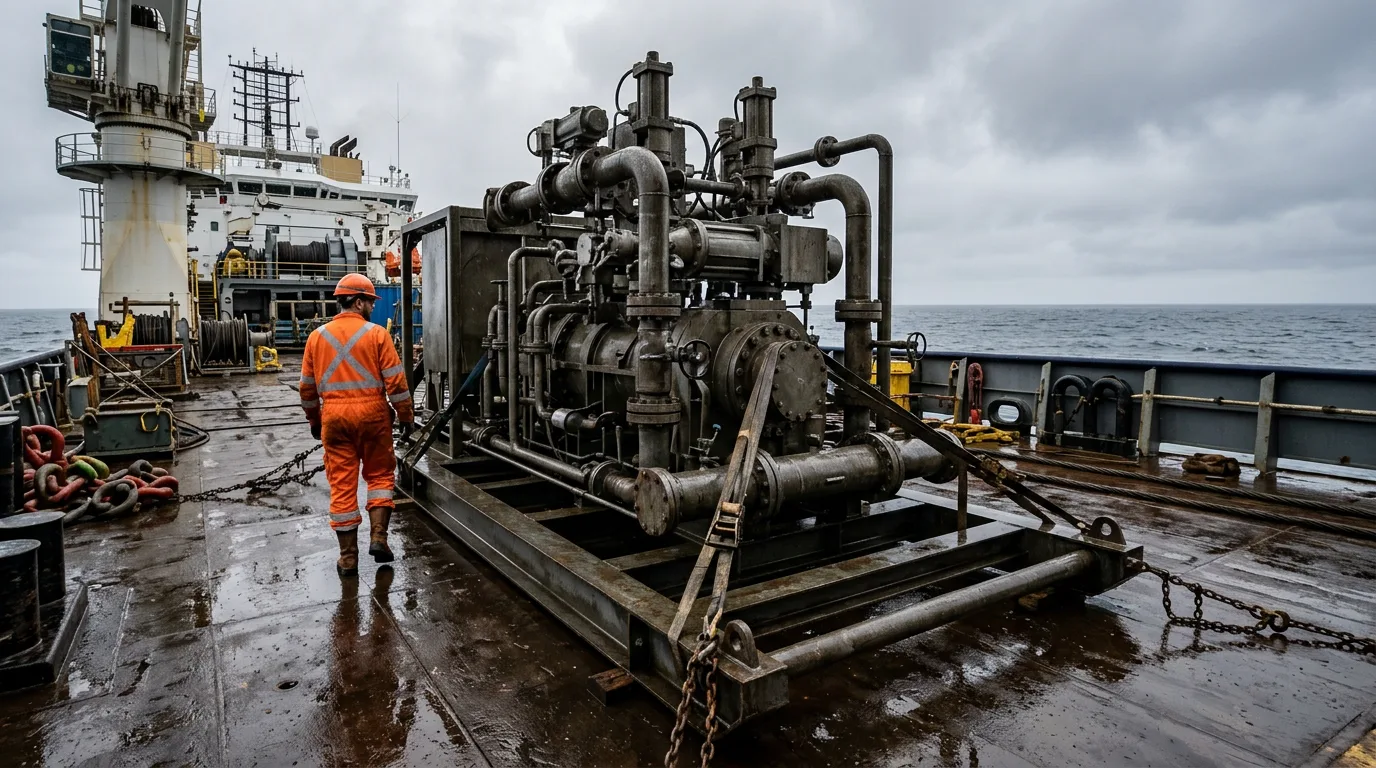
The cost of an unplanned subsea pump stop
A subsea pump station that trips unexpectedly takes the boosted production with it. Recovery means mobilising an intervention vessel, retrieving a module or pump, and waiting on spares and weather windows. Pull too early and you give up run life and pay for an intervention you did not need. Pull too late and you take a forced outage, often with collateral damage.
Predictive maintenance for subsea pumping comes down to one question: how long can this pump keep running, and when is the best moment to intervene? Answering it well takes the right data, indicators, models and decision rules. This article walks through each of them.
Standards and requirements context
No single standard prescribes a subsea predictive maintenance programme, but several frame it:
- ISO 17359 (Condition monitoring and diagnostics of machines, general guidelines) describes how to structure a programme: criticality, failure modes, measurable parameters, and review.
- ISO 13374 (Condition monitoring and diagnostics of machines, data processing, communication and presentation) defines a layered flow from data acquisition through to advisory generation. It is useful when specifying what the subsea control system and the topside historian must exchange.
- ISO 13381-1 (Condition monitoring and diagnostics of machines, prognostics) sets out general guidelines for prognosis. It is the reference for how remaining-life estimates should be framed and caveated.
- ISO 14224 (Collection and exchange of reliability and maintenance data for equipment) gives the taxonomy for failure modes and causes. Consistent failure records are the foundation for any model trained on history.
- API 610 (Centrifugal pumps for petroleum, petrochemical and natural gas industries) covers conventional pumps. It is a useful benchmark for seal, bearing and vibration practice, but subsea pump design basis is normally set by project and manufacturer specifications.
- IEC 61511 (Functional safety, safety instrumented systems for the process industry sector) matters because predictive alarms must stay separate from safety functions. A prognostic advisory must never be wired in as a protective trip.
Failure modes drive sensor selection
Start from how the pump station fails, not from the sensors you already have. Typical degradation paths for a subsea pump module include:
- Bearing wear or lubrication degradation, in the pump or motor.
- Mechanical seal wear and loss of barrier or buffer fluid integrity.
- Motor winding insulation ageing and moisture ingress.
- Hydraulic degradation from erosion, deposition or recirculation, which shows as lost head at a given flow and speed.
- Rotor imbalance or misalignment, including from solids damage.
- Power and control path faults: penetrators, cables, drive and sensor failures.
Sensor faults deserve explicit attention. A drifting transmitter gives you a false trend. On a system you cannot touch for years, that is a leading cause of both false alarms and missed degradation.
Core measurements and what they reveal
| Measurement | Primary failure information | Main limitation |
|---|---|---|
| Vibration (accelerometers or proximity probes) | Bearing condition, imbalance, misalignment, cavitation signatures | Bandwidth and data volume through the subsea link; mounting sensitivity |
| Bearing and winding temperature | Lubrication loss, overload, cooling degradation | Slow response; strongly affected by process and ambient conditions |
| Motor current and voltage (MCSA) | Electrical and some mechanical faults without extra subsea hardware | Needs a stable load and good signal quality; drive harmonics complicate analysis |
| Barrier/buffer fluid pressure, level, flow | Seal leakage and consumption trend | Requires a well-characterised baseline |
| Suction and discharge pressure, flow, speed | Hydraulic performance, wear, fouling | Needs correction for fluid properties and operating point |
| Insulation resistance | Winding ageing, moisture ingress | Coarse; slow to change until late |
Motor current signature analysis looks attractive for subsea because it runs on signals you already have topside. That is a vendor claim made for general industrial applications, though, not subsea-specific evidence. Validate it on your own equipment before you rely on it.
From raw data to condition indicators
Normalise for operating point
Vibration, current and temperature all move with speed, flow, suction pressure and fluid properties. Raw trends mix degradation with process changes, so you need indicators that strip out the operating-point effect:
- Define operating regimes, for example by speed band and flow band, and compare only like with like.
- Establish a baseline from the commissioning and early-life data of the individual pump, not a fleet average.
- Compute residuals: the difference between measured values and a baseline model prediction at the current operating point.
- Trend the residuals and their rate of change, not only absolute values.
Features that tend to carry signal
- Vibration: overall level and narrowband components at running-speed harmonics and bearing-related frequencies. Where bandwidth is limited, extract features subsea or at an edge processor and transmit only those.
- Electrical: sidebands and harmonics in the current spectrum, and phase imbalance.
- Hydraulic: head-versus-flow deviation from the pump curve at a given speed, and power draw versus hydraulic output.
- Barrier system: net consumption of barrier fluid compared with its baseline, and pressure differential stability.
Combine indicators into a health index
Single indicators throw false alarms. A health index fuses several normalised indicators, through weighted scoring for example, so that independent measurements agreeing with each other raises your confidence. Confirmation across physically different measurements is the most practical protection against a faulty sensor driving a decision.
Prognostic methods compared
| Approach | How it works | Strengths | Weaknesses |
|---|---|---|---|
| Trend extrapolation on indicators | Fit a trend to a degrading indicator and project it to a limit | Transparent, quick to implement | Needs a defensible limit; poor when degradation accelerates |
| Physics or model-based residuals | Compare measurements with a hydraulic, thermal or electrical model | Works with little failure history; explains the cause | Model effort; sensitive to model error |
| Data-driven remaining useful life (RUL) models | Learn degradation patterns from historical run-to-failure data | Capture complex multivariate behaviour | Need representative failure data, which subsea fleets rarely have in volume |
| Hybrid | Physics-derived features feeding statistical or learning models | Balances interpretability and flexibility | More engineering effort |
Recent work on offshore electric submersible pumps shows the data-driven end of the range. The attention mechanism weights both which input signals and which time steps matter, which helps with multivariate sensor streams. ESP datasets are larger and their failure records more plentiful than what most subsea booster fleets can offer, though. Treat the method as a template and check the data requirement before you commit to it.
The training-data question applies just as much. Ask what failures the model has actually seen, and on what class of equipment.
Link prediction to the maintenance decision
A prognosis only earns its keep when it feeds an intervention decision. The real question is not "when will it fail?" It is "which policy minimises expected loss, given prediction uncertainty, vessel lead time and spares position?"
| Strategy | Trigger | Typical outcome |
|---|---|---|
| Run to failure | Failure | Unplanned downtime and collateral damage |
| Time-based | Fixed interval | Some premature interventions; failures between intervals still occur |
| Condition-based | Indicator crosses a defined level | Reacts to degradation; limited lead time if the level is set late |
| Predictive | Forecast of RUL against lead time | Intervention scheduled to fit logistics, if the forecast is credible |
The Crane Engineering article on preventive versus predictive pump maintenance makes the same general point. Reactive maintenance drives unplanned downtime and cost, and programmes should combine preventive and predictive elements rather than pick one.
Illustrative scenario: seal barrier degradation on a subsea booster
The following is an illustrative scenario, not a reported case, and it uses no field figures.
A subsea booster pump has run steadily since commissioning. Over several months, topside engineers see the following:
- Barrier fluid consumption slowly rises relative to the commissioning baseline at comparable speed and pressure.
- Vibration at running-speed harmonics creeps up in the same operating regime.
- Motor current shows no clear change, and hydraulic head at a given flow is steady.
Working through it:
- Two physically independent indicators, barrier consumption and vibration, are both drifting, while the hydraulic and electrical indicators are not. That pattern points to a mechanical seal or bearing issue, not a hydraulic or winding problem.
- A sensor fault is less likely, because the two measurements come from different transducers.
- The team fits a trend to the barrier consumption residual and gets a projected crossing of the level at which the barrier reservoir inventory can no longer be maintained. That level comes from the design basis, not from the model.
- They compare the projected crossing, with its uncertainty range, against the lead time for vessel, spare module and weather window. The conservative end of the range is the one that counts.
- If the conservative projection falls inside the lead time, they raise the intervention now. In the meantime, they reduce speed or duty if the process allows, to slow the degradation.
The decision uses the earliest credible date, not the central estimate. Being early costs far less than a forced stop.
Checklist and decision guidance
Programme set-up:
- Build a failure-mode list for the specific pump, motor, seal system and power path, using ISO 14224 terms.
- Map each failure mode to at least one measurable indicator, and to a second independent one where possible.
- Capture commissioning baselines for every operating regime of interest and store them with the raw data.
- Decide what is processed subsea or at the edge and what is transmitted, given link bandwidth.
- Keep prognostic advisories separate from safety instrumented functions under IEC 61511.
Model and data governance:
- Check sensor health first, and flag drift or flat-lining before trending anything.
- Record how every threshold was derived: design limit, manufacturer data or statistical baseline.
- Report forecasts with uncertainty and act on the conservative bound.
- Validate any vendor or machine-learning model against your own failure history, or state clearly that none exists.
- Feed every intervention's findings back into the failure database and recalibrate the models.
Intervention planning:
- Compare forecast against logistics lead time: vessel, tooling, spare module, weather window.
- Pre-position spares as soon as the health index shows sustained deterioration.
- Review operating changes, such as lower speed or reduced solids exposure, that could extend life.
Safety for any retrieval or topside work on hydrocarbon-containing equipment:
- Isolate the pump station from the process and the hydraulic and electrical supplies.
- Depressurise, and verify zero energy by direct measurement before breaking containment.
- Apply LOTO to electrical, hydraulic and chemical injection sources.
- Treat the work area as hazardous: use certified equipment, control ignition sources and use continuous gas detection.
- Vent and drain to a safe location through the approved route, never to open deck areas.
Conclusion
Predictive maintenance for subsea pump stations works when you build it from failure modes upward. Choose indicators tied to specific degradation paths, normalise them for operating point, confirm them across independent sensors, and express forecasts against the logistics lead time that actually constrains you. Data-driven RUL models are promising, but they depend on failure data that many subsea fleets lack. For most teams, a hybrid approach that pairs physical understanding with statistical trending is the safer place to start.
As next steps, run a failure-mode and indicator mapping workshop for your highest-criticality pump, lock in the baselines now while the equipment is healthy, and test your forecasting approach on historical data before relying on it for an intervention decision.