Pulling a crude tank out of service for internal inspection takes working capacity away from a terminal that earns its money by moving barrels. Commercial pressure therefore pushes inspection intervals out. Meanwhile, higher turnover drives bottom corrosion rates and fatigue loading up. If the interval is set from a corrosion rate measured under yesterday's duty, the margin the calculation seems to show may not be there. You end up with either an unplanned shutdown after a leak, or a conservative interval that costs capacity you didn't need to lose.
This article goes through the bottom-plate degradation mechanisms that matter most in crude service. It then looks at how faster stock turnover changes them, and how to keep API 653 interval logic defensible when operating patterns shift.
Standards context
API 653, Tank Inspection, Repair, Alteration, and Reconstruction, is the governing framework for in-service tanks. Construction requirements sit in API 650, Welded Tanks for Oil Storage. Practical inspection technique is covered in API 575, Inspection Practices for Atmospheric and Low-Pressure Storage Tanks. If you go risk-based, API 580 (Risk-Based Inspection) and API 581 (Risk-Based Inspection Methodology) give you the framework. For bottom protection, look at API 651 (Cathodic Protection of Aboveground Petroleum Storage Tanks) and API 652 (Lining of Aboveground Petroleum Storage Tank Bottoms).
The logic of API 653 is consistent across the sources reviewed. Internal inspection intervals follow corrosion rates measured at previous inspections, or anticipated from tanks in similar service. In the text reproduced in the NRC-hosted copy, bottom corrosion rates normally control the interval. One practitioner summary describes intervals as driven by corrosion rate, remaining thickness, and the projected date at which minimum allowable thickness is reached. It also notes that intervals typically fall between 5 and 20 years, and that risk-based methods under API 580/581 can support the decision. Treat those numbers as orientation only. The edition of API 653 in force at your site governs.
The phrase to watch is "tanks in similar service." Raising turnover can move a tank out of the service category it was inspected under.
Bottom corrosion mechanisms in crude service
Becht's discussion of tank bottom life makes the point that a new bottom "is not born into a utopia": it is exposed to many damage mechanisms from day one. Two surfaces are involved, and they behave differently.
Product-side (internal) corrosion
- Water and sediment layer. Free water drops out of crude and settles on the floor along with solids. It usually carries dissolved salts and dissolved gases. The corrosion under it tends to be localised pitting rather than uniform wastage.
- Under-deposit attack. Sludge, scale, and wax trap electrolyte against the steel and set up differential aeration cells. Pits can grow under deposits nobody sees unless the floor gets cleaned.
- Microbiologically influenced corrosion (MIC). Stagnant water and sludge feed bacterial colonies, sulphate-reducing species included. They generate aggressive local chemistry, and pits can grow fast.
- Low points and weld regions. Sumps, the area round the drain, lap-weld seams, and settled depressions collect water first. They tend to show the deepest pits.
Soil-side (underside) corrosion
- Foundation moisture and chlorides. Pad material, ringwall detail, and drainage decide whether the underside stays wet.
- Crevice and edge effects. The annular plate and the shell-to-bottom region are exposed to water getting in at the chime.
- Cathodic protection limitations. Under a large floor, cathodic protection depends on the pad, on plate-to-soil contact, and on any secondary containment liner or release prevention barrier. Poor contact or shielding leaves areas unprotected even when the system reads as working.
Soil-side corrosion is the harder one to see. Without floor scanning, in-service monitoring only reaches the shell and the visible edge.
The published literature on rate estimation
The common thread is that the rate is an estimate with uncertainty. The interval is only as good as the thickness data and the assumptions behind the rate.
How accelerated turnover changes the picture
Higher throughput doesn't push the tank in one direction. Some effects lower corrosion risk and others raise it.
| Factor | Effect of higher turnover | Consequence for inspection planning |
|---|---|---|
| Water and sediment accumulation | Frequent receipts may bring more water in total, but less time for it to settle undisturbed. Drawdown and mixing may resuspend deposits. | Deposit distribution changes, so pit locations from the last inspection may not predict new ones. |
| Dissolved oxygen and fresh electrolyte | Each fill introduces fresh product and water chemistry. | Rate may rise relative to a tank in low-turnover service. |
| Crude slate variability | Faster cycling often means more varied crude grades, with differing salt, sulphur, and acid-gas content. | The historical rate may not represent the current fluid. |
| Operating level cycling | More frequent floor and shell-to-bottom flexing. | Fatigue at the critical zone becomes a concern alongside wastage. |
| Sediment settling and MIC | Less quiescent time may suppress some sludge build-up. | Benefit is not guaranteed and should not be assumed without evidence. |
| Cleaning and access | More frequent outages are harder to schedule. | Pressure to defer inspection rises as the need for it may be growing. |
The central planning error is projecting a rate from a period of lower turnover onto a tank that is now running harder. Rates from earlier inspections describe earlier conditions. If duty has changed materially since the last scan, that rate is a lower-confidence input. The interval derived from it needs a conservative adjustment or an earlier verification.
Interval logic and what changes with turnover
The interval logic itself is simple. Remaining life to the minimum allowable thickness is:
Remaining life (years) = (t_measured − t_minimum) ÷ corrosion rate
where t_measured is the minimum thickness found at inspection (mm), t_minimum is the minimum allowable bottom thickness for the tank (mm), and corrosion rate is in mm/year. The interval can't exceed the code maximum, and judgement on uncertainty may cut it further.
Illustrative example
The figures below are assumed for illustration and are not from a real tank.
A crude tank bottom has a minimum measured thickness of 6.0 mm after the last inspection. The assumed minimum allowable thickness is 3.0 mm. The corrosion rate, determined under the earlier duty, is 0.15 mm/year.
- Available wall loss = 6.0 mm − 3.0 mm = 3.0 mm
- Remaining life = 3.0 mm ÷ 0.15 mm/year = 20 years
The terminal then raises throughput and crude diversity. Suppose the rate, now assumed to be 0.30 mm/year, doubles because of fresh water, more varied crude chemistry, and disturbed deposits.
- Remaining life = 3.0 mm ÷ 0.30 mm/year = 10 years
Doubling the rate halves the available life. The tank that looked suited to the longest interval now supports half that, before any uncertainty margin. In practice the second rate isn't known until the next inspection, which is why the order of operations matters. Deferring inspection on a tank whose duty has changed can burn through margin the planner believes is still there.
Tools for managing the uncertainty
Measure the right thing
Floor scanning, such as magnetic flux leakage with ultrasonic verification of indications, covers the product side in a way spot UT can't. Soil-side scanning is limited by pad contact and any secondary containment barriers, so verify cathodic protection performance by survey to judge underside protection. In crude service, pit depth rather than average loss usually sets remaining life. Record soil-side and product-side loss separately where the technique can tell them apart. The two mechanisms respond differently to operating changes.
Use risk-based inspection deliberately
RBI under API 580/581 is the established route to justify intervals that differ from prescriptive defaults. It only works if the inputs reflect current duty. Update turnover, crude slate, water handling, and cathodic protection performance when they change. An RBI case built on historic operating data is not evidence for a longer interval.
Mitigate to buy interval
- Maintain water draw-off discipline and sump drainage.
- Where practical, use mixing or sludge management so deposits don't persist.
- Maintain cathodic protection and verify it with surveys, not just rectifier output.
- Consider a bottom lining where API 652 applies and the economics support it.
- Check the foundation, drainage, and chime sealing for water ingress.
Safety during internal inspection
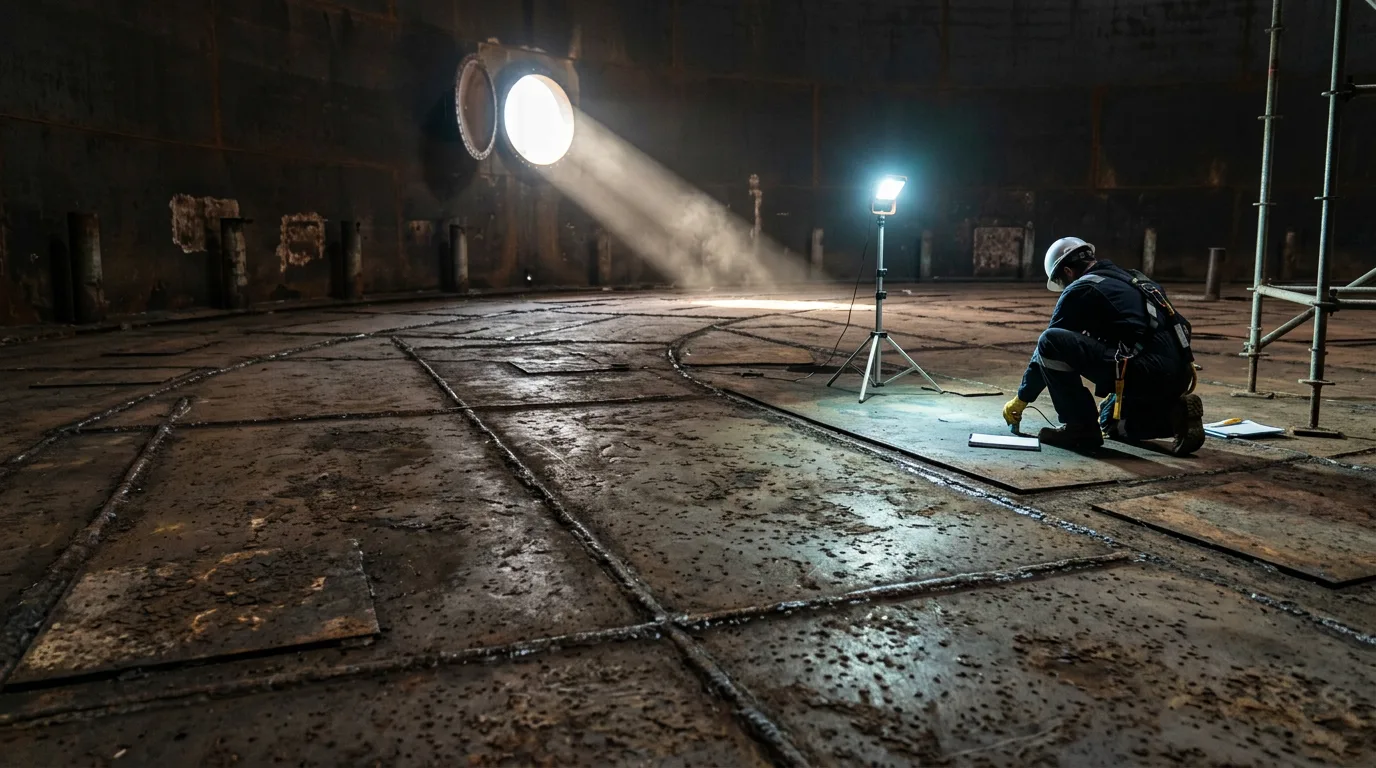
Opening a crude tank for internal inspection is a confined-space and hazardous-area job. Typical sequencing:
- Isolation. Close and blind or physically disconnect all product, drain, and utility connections, including mixers and heating lines. Work to a documented isolation plan.
- Draining and cleaning. Remove product and sludge using controlled methods. Sludge can release hydrocarbon vapour and hydrogen sulphide, and pyrophoric iron sulphide deposits can ignite on drying.
- Depressurisation and venting. Vent displaced vapour to a safe location per site procedures. Manage static accumulation.
- Verification of zero energy. Confirm that all connected lines are isolated and drained, and that mechanical equipment is de-energised.
- Lockout/tagout. Apply LOTO to mixers, pumps, valves, and electrical supplies.
- Gas testing and detection. Test for flammable gas, oxygen, and toxics before entry. Monitor continuously during entry, using calibrated instruments suited to the atmosphere.
- Hazardous-area precautions. Use certified equipment and controlled ignition sources. Keep the hot work permit system separate from entry permits.
- Confined-space controls. Provide attendants, rescue arrangements, ventilation, and communication.
Decision checklist
- Has throughput, crude slate, water cut, or operating level cycling changed since the last internal inspection? If yes, treat the old corrosion rate as lower confidence.
- Was the previous rate measured from reliable thickness data, with consistent measurement locations and technique?
- Is the controlling rate soil-side or product-side, and has that changed?
- Do pits, rather than average wall loss, set remaining life for this tank?
- Is cathodic protection performance verified by survey?
- Does the RBI case use current operating data and documented assumptions?
- Is the planned interval within the code maximum and backed by calculated remaining life with margin?
- If deferring, is there a documented basis, such as in-service monitoring or an earlier verification scan?
- Is the outage plan resourced early enough that scheduling pressure doesn't drive the interval?
Conclusion
Corrosion rates belong to a tank and its duty, not to the tank alone. When a terminal raises turnover, the first job is to review the basis of the existing interval rather than carry it forward. Compare the operating conditions behind the last rate with current ones. Update the RBI inputs, verify cathodic protection, and where the change is material, bring the next floor scan forward or build a documented case for why it can wait. Then confirm your site's API 653 edition and recalculate remaining life on current data.